
Water balance
The terms, not just the total
Evapotranspiration, rain, irrigation, drainage, the water held in each soil layer: the balance is open, so you can argue with it. A number you cannot interrogate is a number you cannot defend to a grower.
For agronomists
You already know what the crop needs. What costs you time is doing it for thirty fields at once, on soils you have not walked, with a week of weather that has not happened yet. Agorà runs that part.
In your hands, not in a black box
Water balance
Evapotranspiration, rain, irrigation, drainage, the water held in each soil layer: the balance is open, so you can argue with it. A number you cannot interrogate is a number you cannot defend to a grower.
Scenarios
Change the crop, the soil or the season and run it again. What a field would answer in four months, the twin answers while you are still on the phone.
Assessment
Replay a season that has already happened and see which of those irrigations changed the outcome and which only moved water. It is the shortest argument for changing a habit.
In Agorà Studio
Choose the field, crop and weather year, inspect the model parameters and follow the water through the season: rain, irrigation, soil water reserves and evapotranspiration.
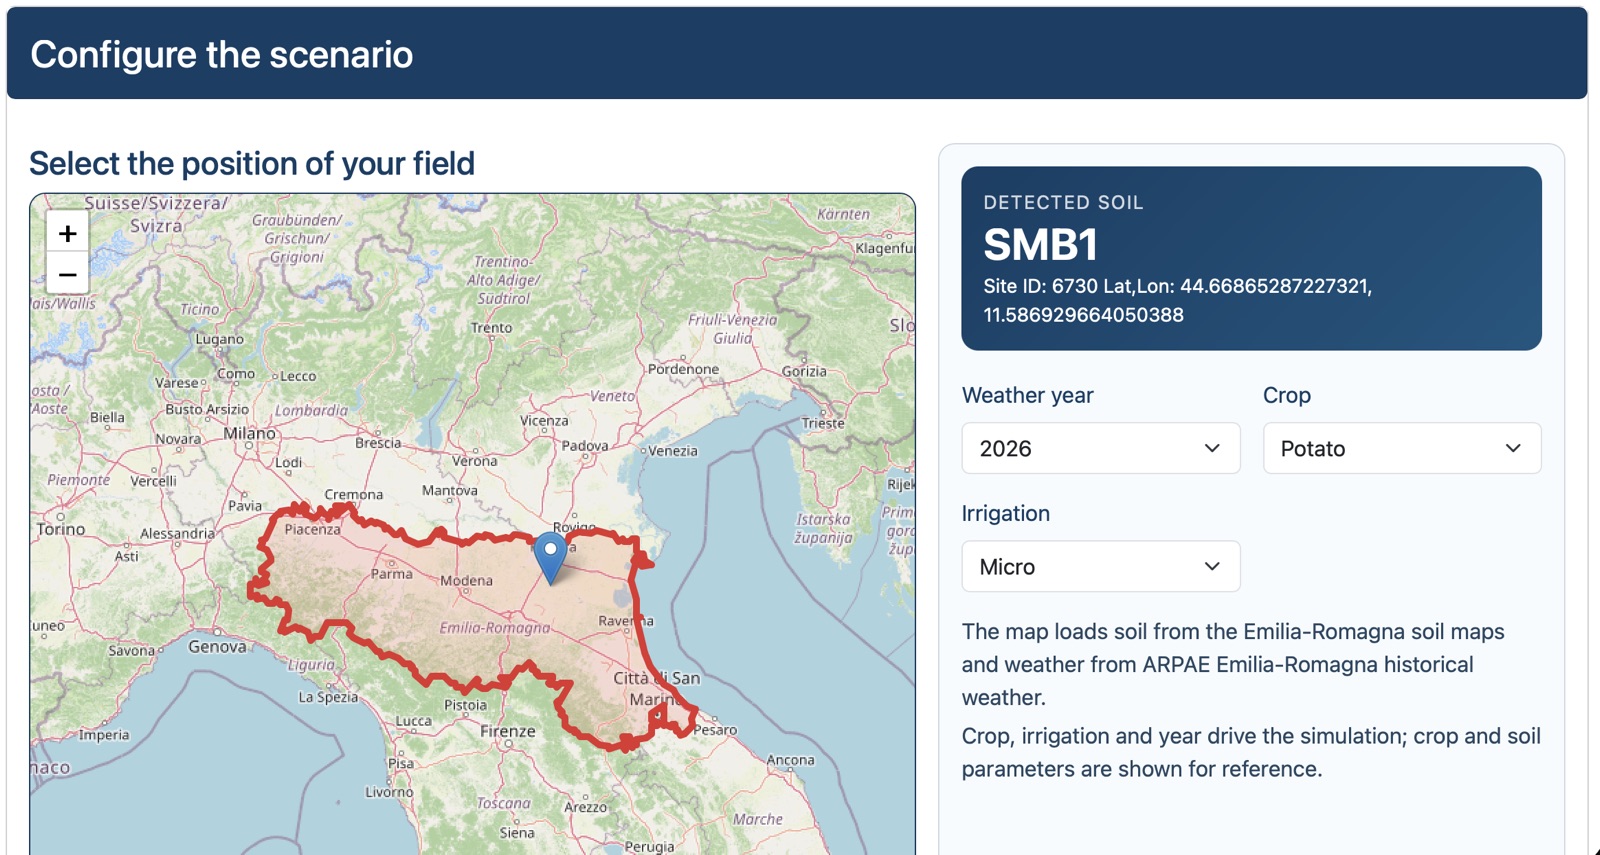
Start with the field on the map. The soil is detected from the Emilia-Romagna soil maps; choose a weather year, crop and irrigation method to define the scenario.
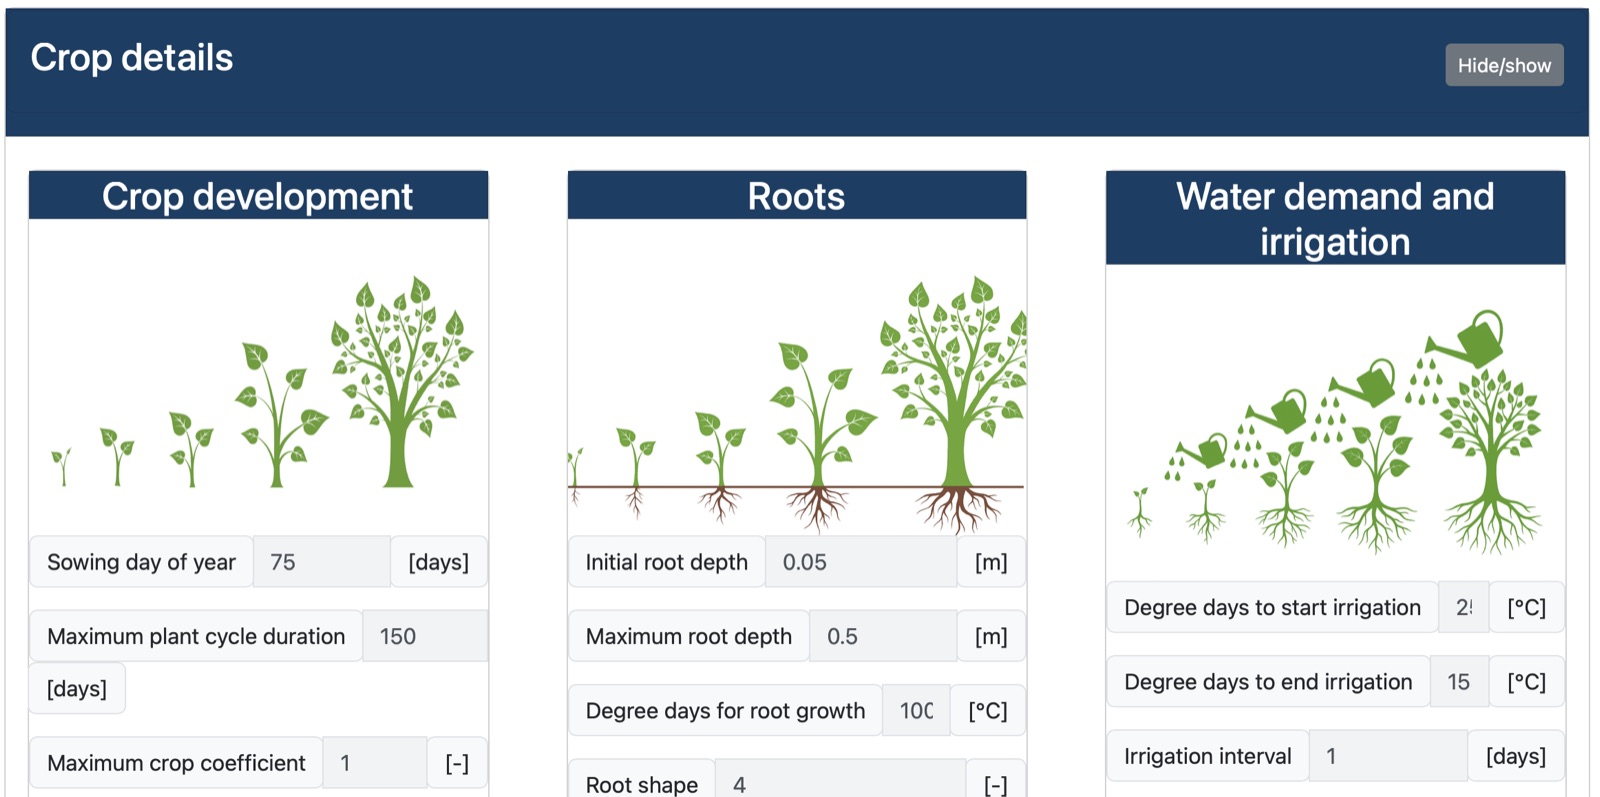
The crop parameters stay visible: sowing date and cycle duration, crop coefficient, root depth and the degree-day thresholds that govern irrigation.
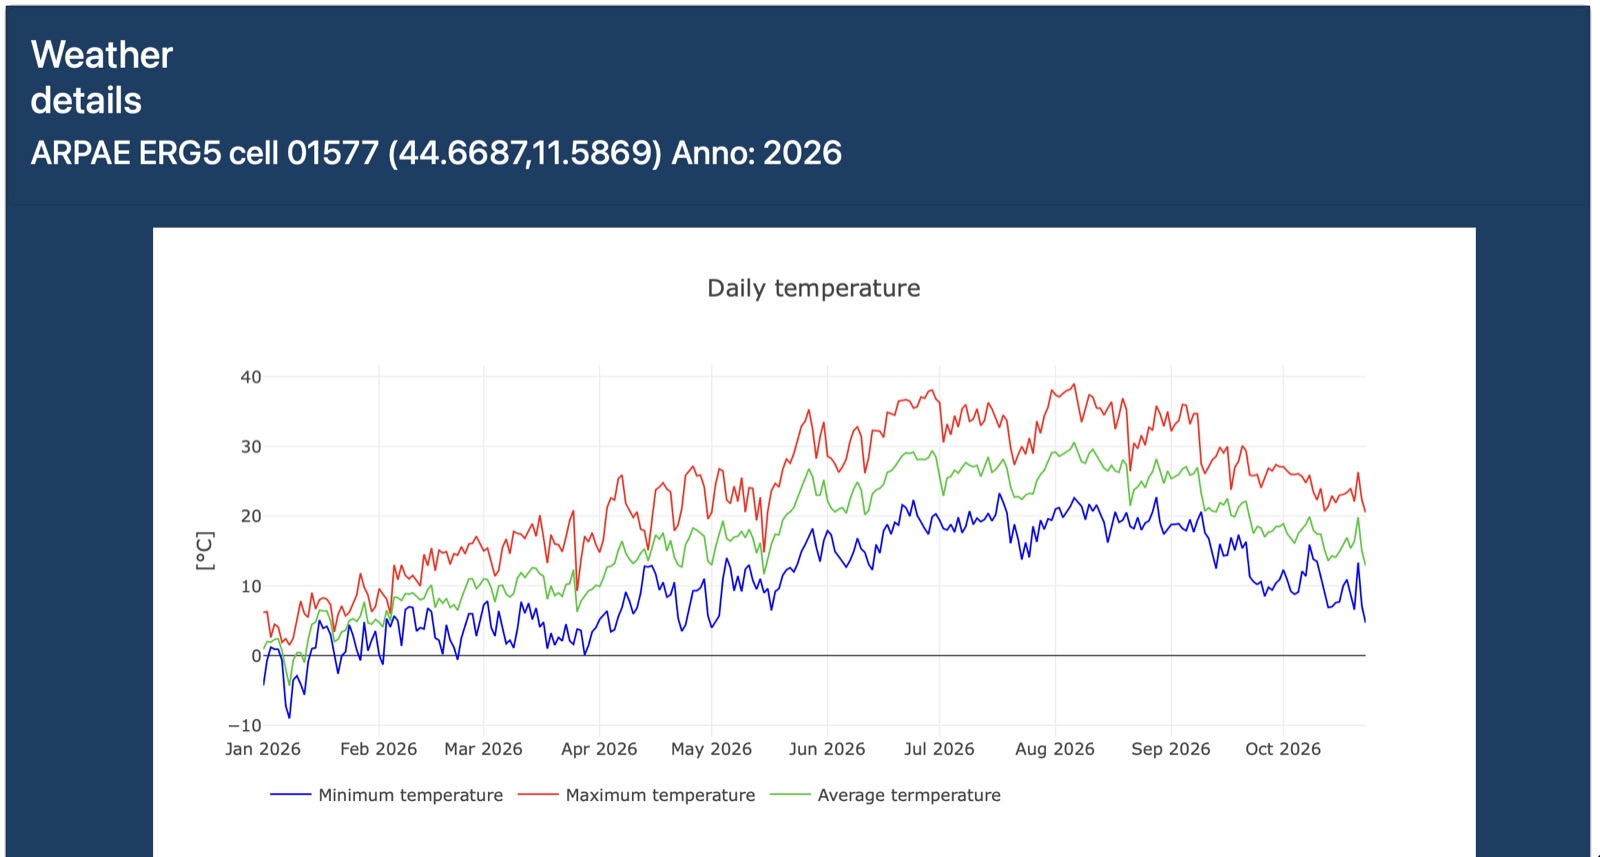
The weather the simulation starts from: daily minimum, maximum and mean temperatures from ARPAE’s ERG5 grid, for the selected location and year.
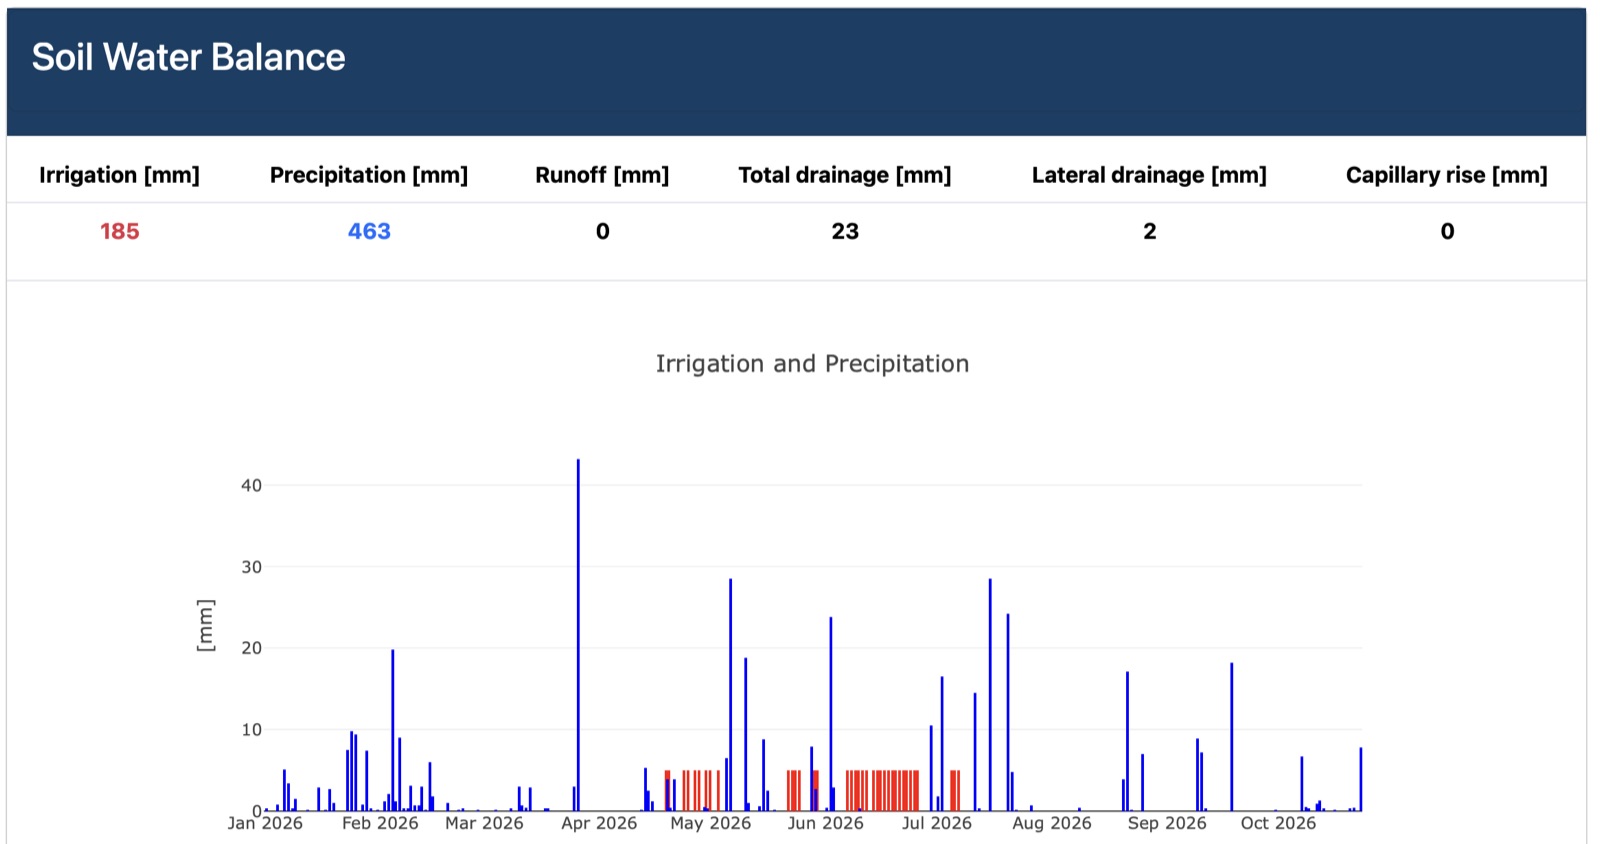
Inputs and outputs, not just a total: irrigation, precipitation, runoff, drainage and capillary rise. The chart shows when rain falls and when the model irrigates.
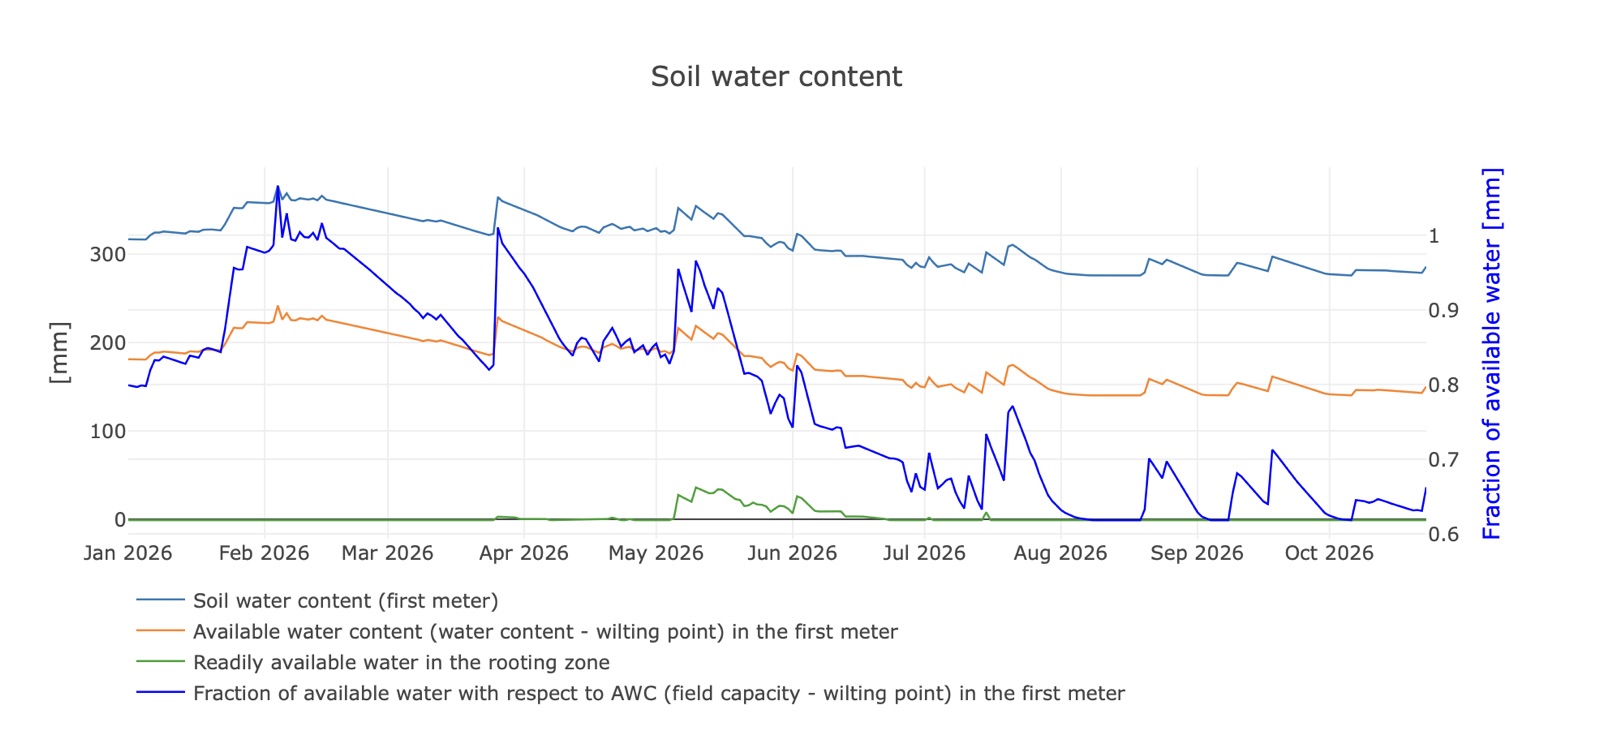
The soil water reserve, day by day: water content and available water in the first metre, readily available water in the rooting zone and the available fraction relative to the soil’s available water capacity.
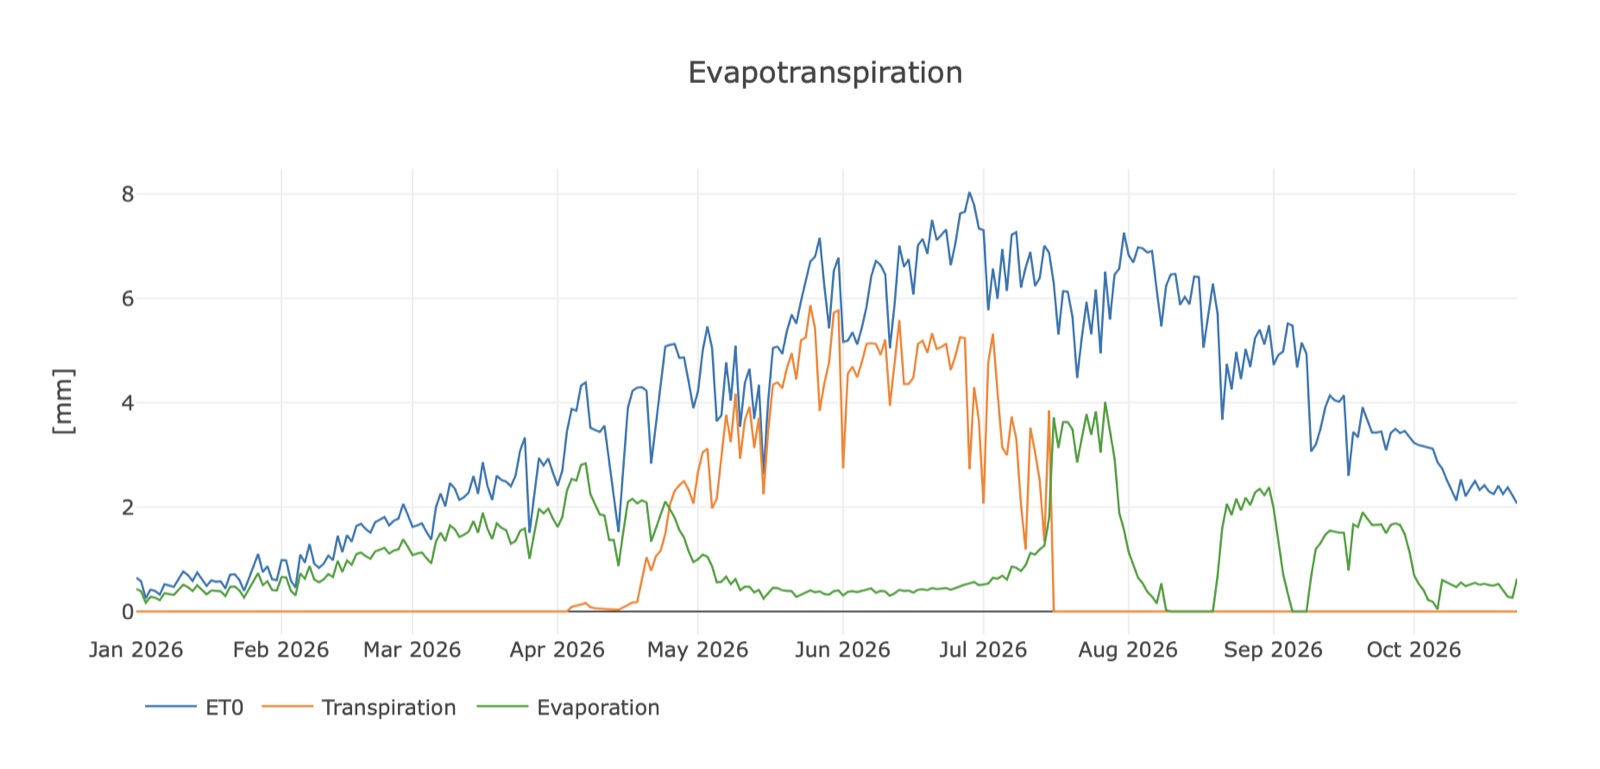
Atmospheric demand and the field’s response: reference evapotranspiration (ET₀), crop transpiration and soil evaporation, shown separately through the season.
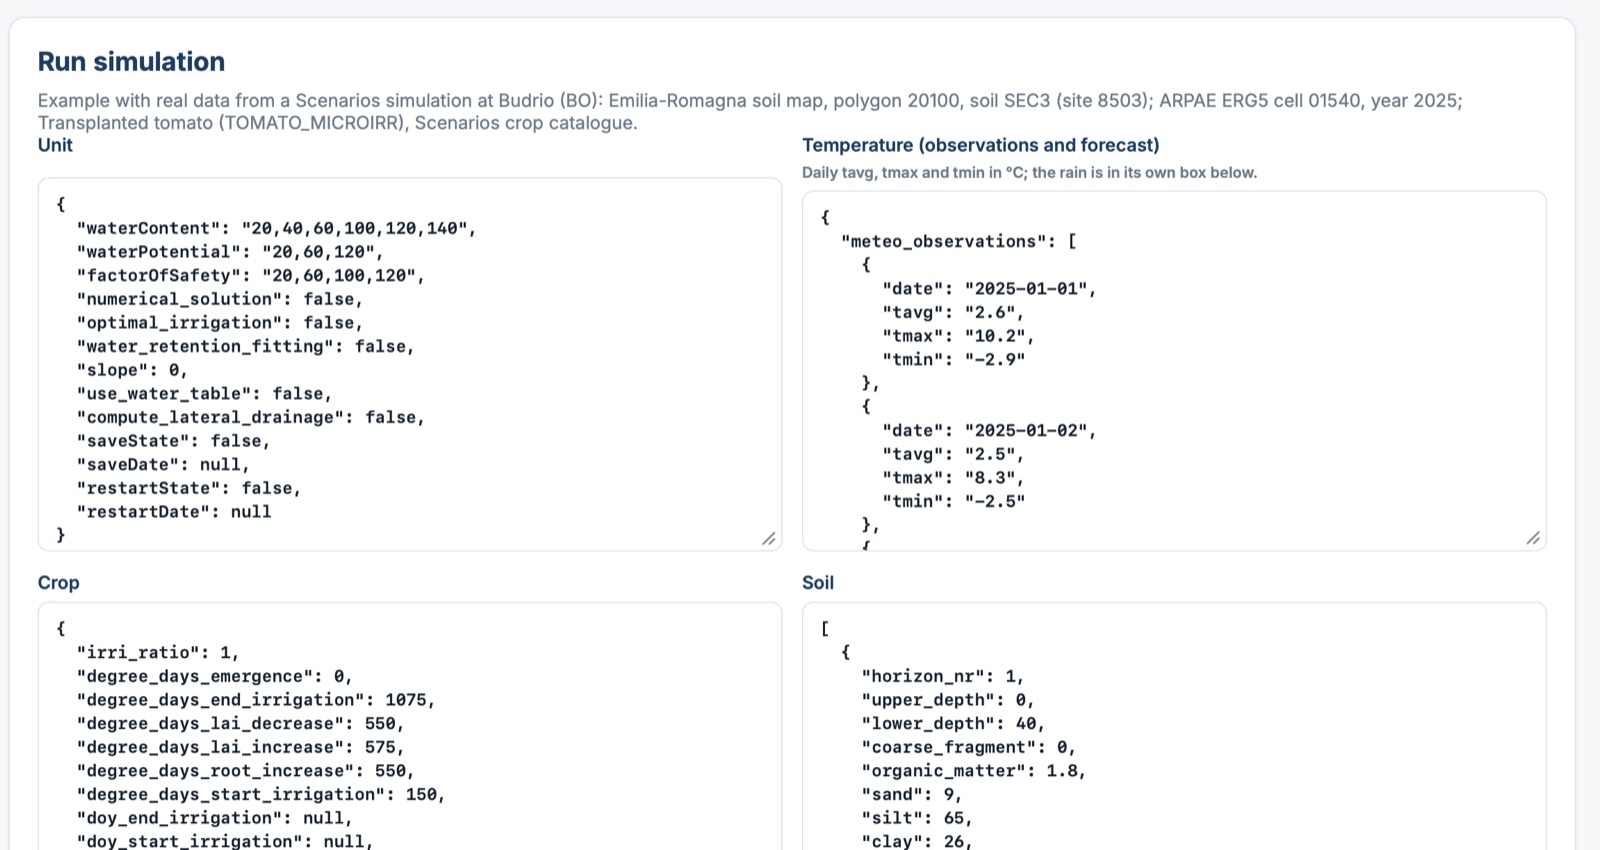
Inside the simulation data: unit, temperatures, crop and soil layers in JSON format. This example uses real data from Budrio (Bologna), year 2025, with transplanted tomato and SEC3 soil.
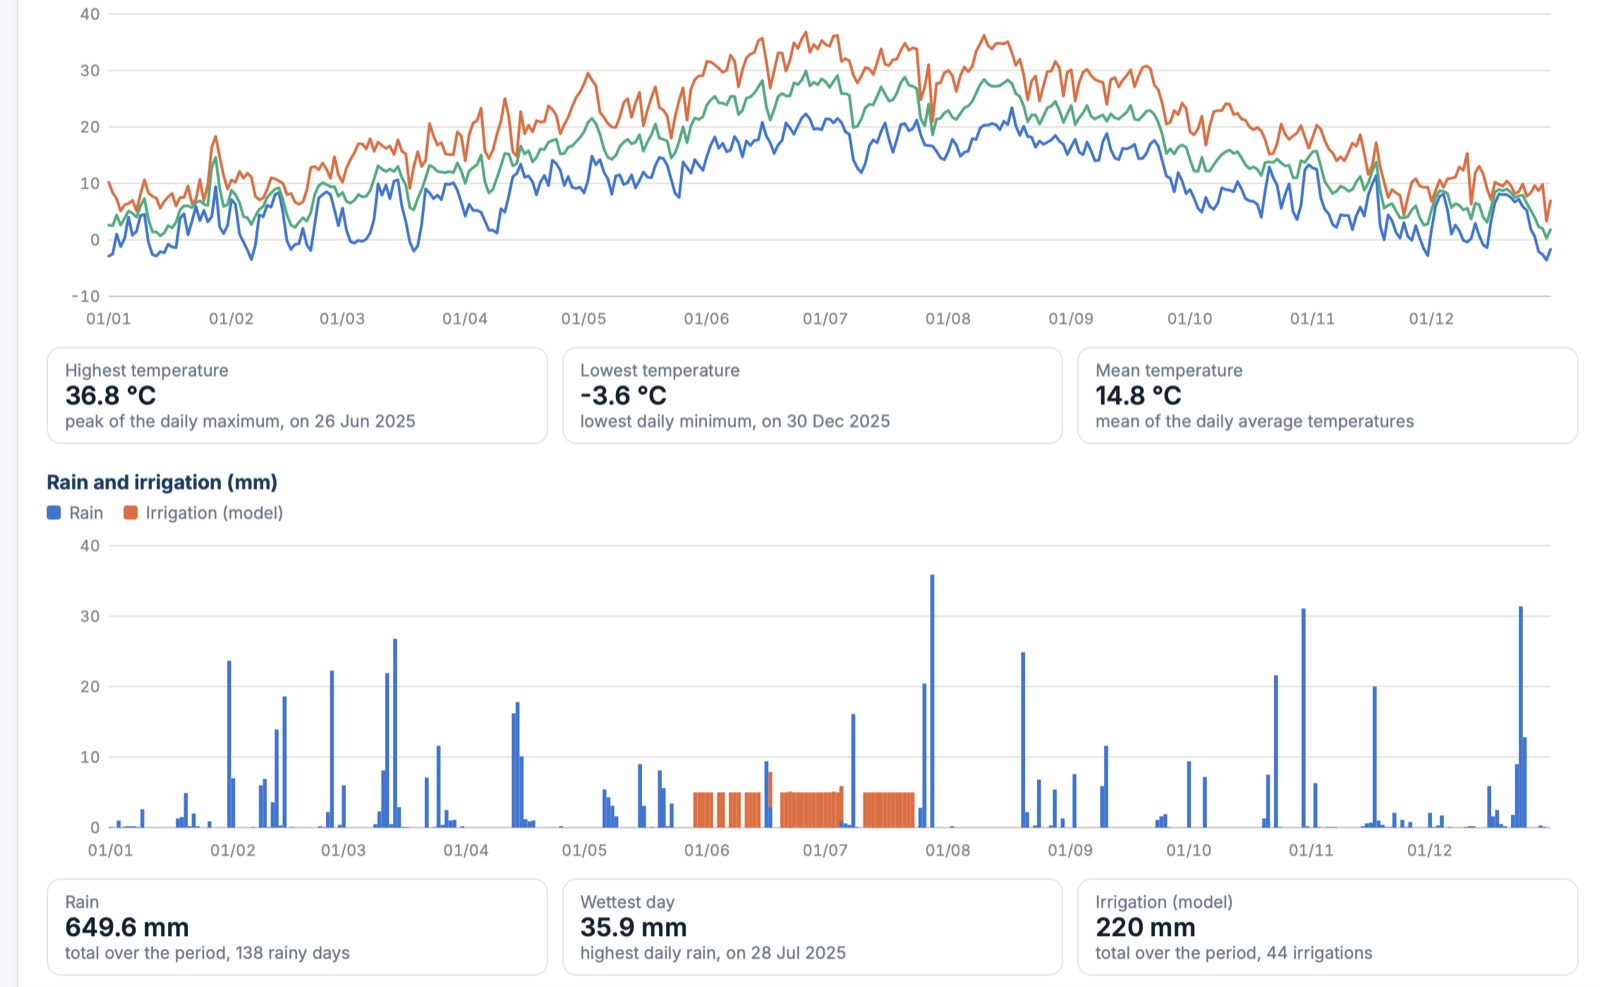
The 2025 example in charts: temperatures and their extremes, rainfall and model irrigation. The summaries report 649.6 mm of rain and 220 mm delivered over 44 irrigations.
Shared demo account — everyone who opens it sees and can change the same data. Register to have your own account activated.