For students

A season in a few minutes, and you can get it wrong.

A real field answers an irrigation decision once a year, in months, and never tells you what the other choice would have done. AgriTwix is a serious game that runs the whole season while you watch, and lets you run it again.

AgriTwix

A serious game on the model that advises real farms.

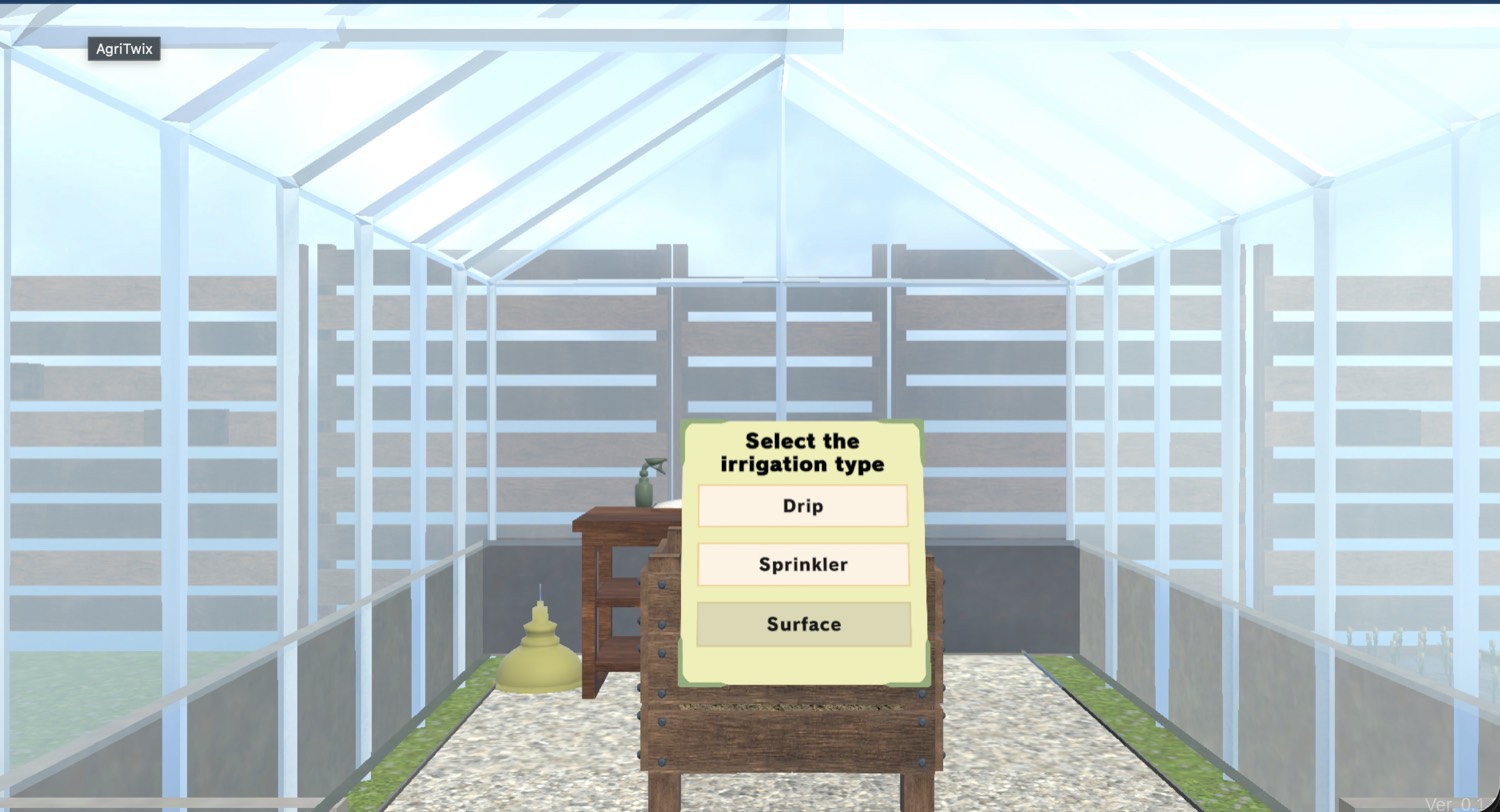
You pick a crop, an irrigation method, a soil and a climate, choose up to six indicators to follow, and then manage the season day by day. Underneath runs CRITERIA1D by ARPAE Emilia-Romagna — the same water balance behind Agorà, and it gives no marks for effort.

The set-up

Ten crops, three methods, twelve soils

Tomato, sunflower, tulip, onion, maize, potato, courgette, wheat, kiwi and apple. Drip, sprinkler or surface. Soils from sand to silty clay. Every combination behaves differently, because the model behind it does.

The decision

Ten seconds a day

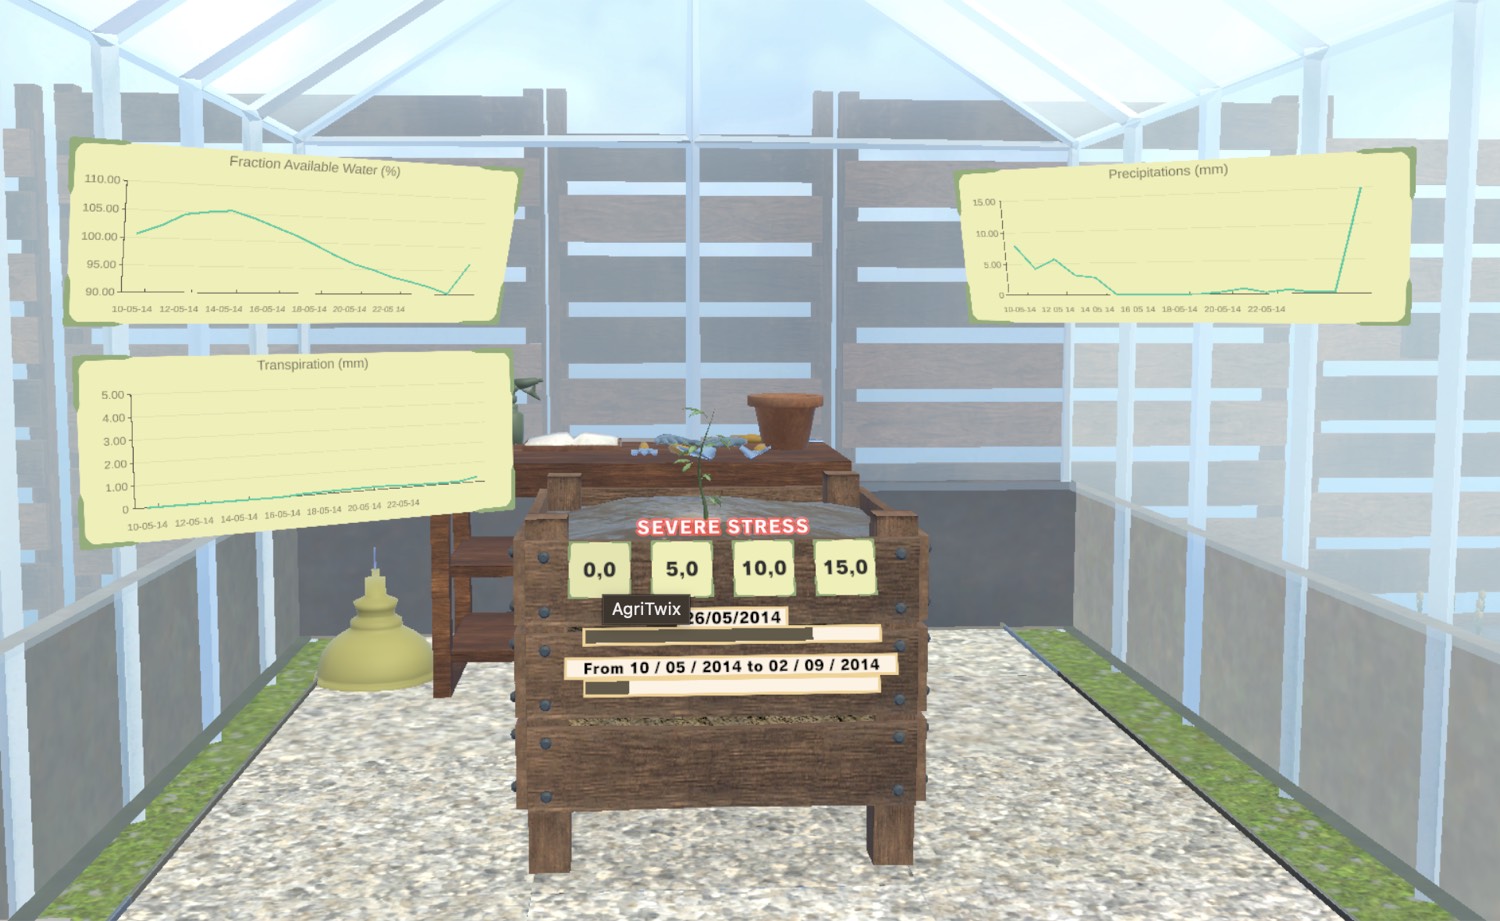
A simulated day lasts ten seconds. In that time you decide whether to irrigate and how much, choosing between three preset volumes — or zero. A whole season fits in a coffee break.

The feedback

Up to six indicators, and the cost of watching them all

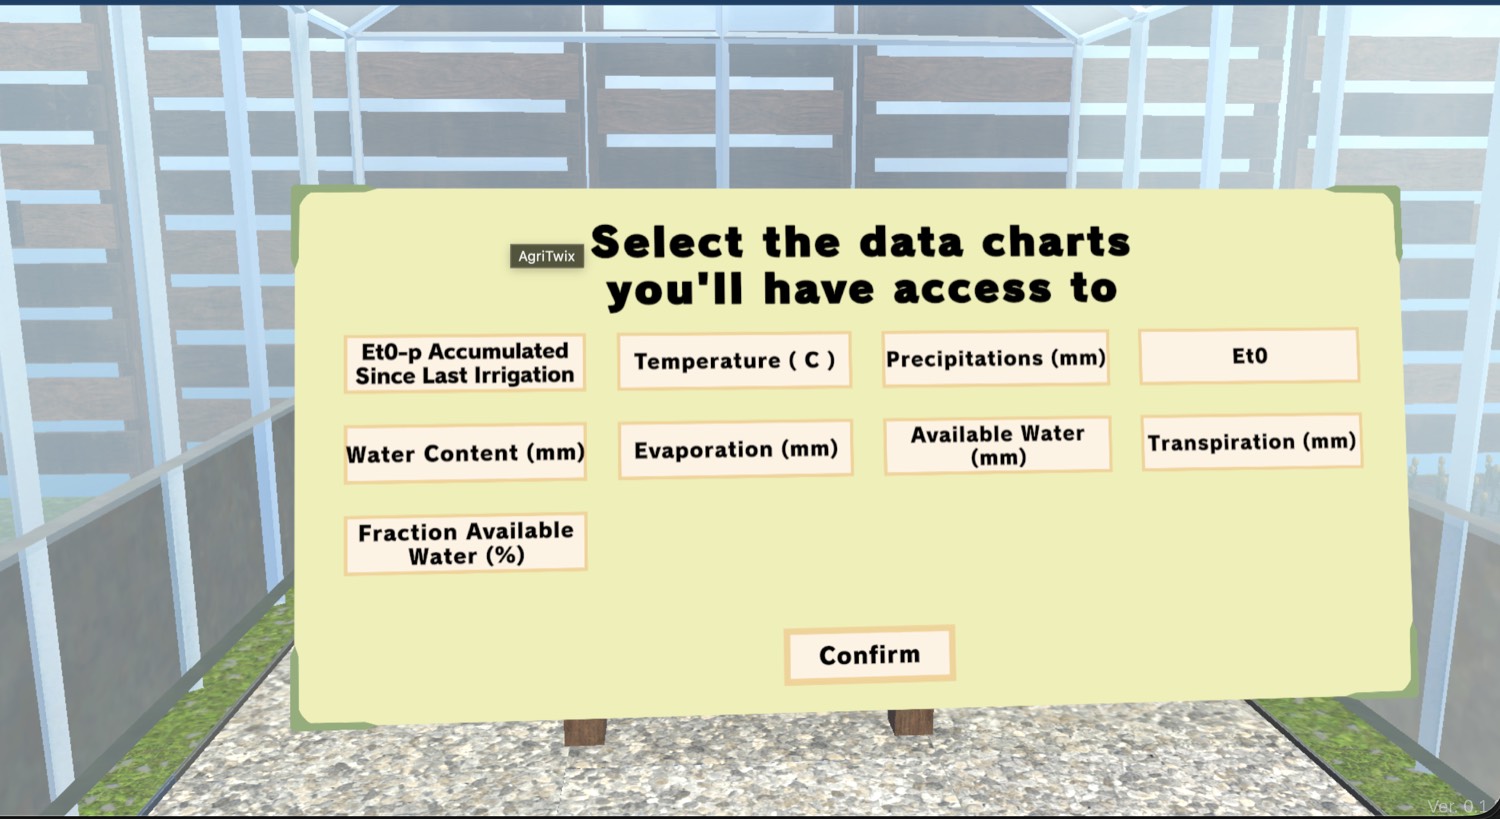
Transpiration, accumulated ET₀, soil water content, evaporation, available water, leaf area index. Follow too few and you are guessing; follow all six and reading the charts takes longer than the day gives you.


European UnionAgriTwix was built in XR4ED, which has received funding from the European Union’s Horizon Europe research and innovation programme under grant agreement No 101093159.

In Agorà Studio

What it looks like from inside the twin.

The season as you watch it unfold: water moving through the soil layers, the crop responding, and the same week run again with a different decision.

  • A sign inside the AgriTwix greenhouse offering drip, sprinkler or surface irrigation

    Drip, sprinkler or surface, chosen on a sign in the greenhouse before the season starts.

  • A board listing nine selectable data charts, from accumulated ET₀ to transpiration

    Nine indicators on offer, six you may carry. The more you take, the longer they take to read.

  • The simulation running: charts floating in the greenhouse, a stressed seedling and four irrigation volume buttons

    26 May, severe stress, and four buttons: 0, 5, 10 or 15 mm. Ten seconds to choose.

Shared demo account — everyone who opens it sees and can change the same data. Register to have your own account activated.